If you’re looking to conduct an economic impact analysis study, chances are someone like you has performed and published something similar using IMPLAN. Conversely, if you’re attempting to study something unlike anything else, between IMPLAN’s data, applications, and knowledgeable customer success and education services teams, you have all the tools you need to get started.
Developed by the United States Forest Service (USFS) in conjunction with the Federal Emergency Management Agency (FEMA) over 40 years ago, IMPLAN boasts an unrivaled history of economic expertise. The USFS remains an active user of IMPLAN today along with a multitude of local, state, and federal government entities, a broad range of renowned academics, economic development entities, professional associations, consultants, and the United Nations.
IMPLAN: Application & Company
You may already have a high-level sense for what IMPLAN is. An important distinction (or commonality) to note is that IMPLAN is in fact both the name of the company as well as the product itself. Over the 40 plus years IMPLAN has existed in varying forms, the software iterations have taken on different names. However, upon replatforming our primary product, we streamlined by calling the new cloud-based application, IMPLAN.
IMPLAN stands for IMpact analysis for PLANning, and IMPLAN as a company strives to help our customers make an impact by delivering the data, applications, and customer services needed to execute their projects appropriately.
Trusted Economic Data
This brings us to the data. Data is what IMPLAN is founded upon and what it continues to specialize in. IMPLAN’s data is compiled from more than 90 authoritative sources on an annual basis. Thousands of data points are amassed to ensure you have the most reliable economic data available.
Detailed Regional Economic Data
Inside of the IMPLAN application, you will find 528 industries represented in the data which allows for incredible differentiation in any analysis.
Take for example industries like energy, alcoholic beverages, or tool production. Many businesses under these categories are similar, but have vastly different spending patterns and economic effects. With IMPLAN’s granular detail, you can analyze your exact industry, like:
- Electric power generation - Wind (industry 43) vs Electric power generation - Solar (industry 42)
- Wineries (107) vs Breweries (106) vs Distilleries (108)
- Hardware manufacturing (245) vs Turned product and screw, nut, and bolt manufacturing (248)
Additionally, all of this IMPLAN data is available at the U.S., state, Congressional district, county, zip code, and MSA levels. Our data team takes the time to collect the most thorough set of economic data to streamline your modeling process. By providing our data to you inside of a user-friendly application, you are afforded versatility and flexibility in your economic impact studies and research like never before.
Where the IMPLAN Application & Data Converge
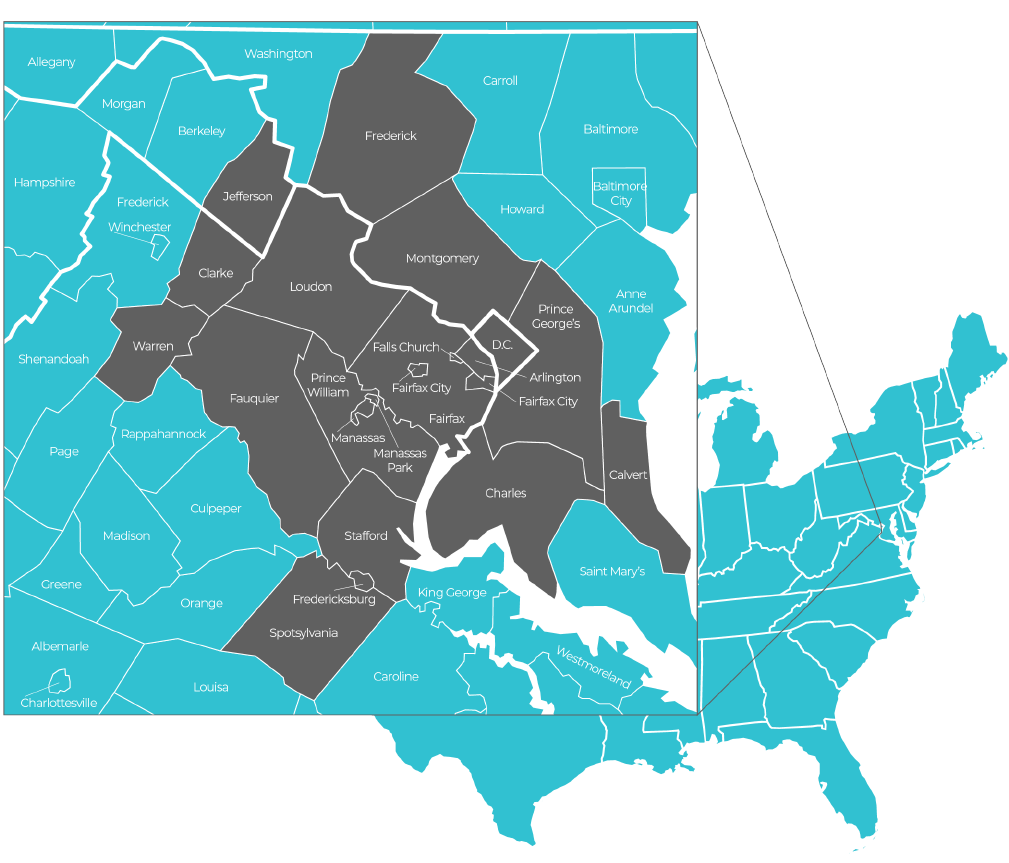
Because IMPLAN data is made available at the U.S., state, county, Congressional district, zip code, and MSA levels, the application is able to allow you to customize your geographic study area using these levels of data granularity. Easily identify, select, and examine your desired region using the zoomable United States map interface. Pre-loaded congressional districts and MSAs are built for you inside of the application. You may also build customized regions to focus on the geographies of most interest for your analysis.

Model & Examine the Impact of Economic Events with Versatility
IMPLAN allows you to bring your own data, expertise, and knowledge to the application and begin an economic impact analysis with any variety of data points, like number of employees a new manufacturer will hire in an area, the dollars spent by tourists at restaurants, or change in wages for existing workers. The robust Impacts page allows you to analyze numerous regions with multiple events (or changes to the economy) at one time.
You can also model an impact to your region of study while examining spillover effects in surrounding areas (all while maintaining the identity of your primary region of interest) by using the Multi-Region Input-Output Analysis function inside of the application.
Upon running your analysis in the application, you are able to sort and filter your results by type of impact or by region to fully understand and explore how to tell the story of your impact, as well as easily filter through data visualizations and summaries.
Lean on Our Experts
Because IMPLAN is so flexible and contains so much data, the sheer amount of options, while exciting, can be overwhelming. To help you get started check out some common approaches to how others have leveraged IMPLAN to conduct their studies. For even more examples and information you will find webinars, case studies, white papers, and more blog posts like this one here.
Also remember, IMPLAN’s customer success and educational services teams are here to help you. All IMPLAN application users are assigned a dedicated customer success representative and given access to IMPLAN’s 24/7 support library stocked with educational and instructional articles. IMPLAN also offers training to get you up to speed.
Additionally, if your project requires extra and more advanced support services, we have multiple levels of support and service options including assistance from our Ph.D. economists and data scientists available for purchase.
IMpact Analysis for PLANning
All in all, IMPLAN is a company with a proud and proven track record spanning 40 years. For anyone looking to model an economic impact (at any regional level), leverage trusted and granular data across 546 industries, and analyze their results in clear and multiple ways, IMPLAN exists to serve you in that endeavor. Economic impact studies require data integrity, trust, and insight along the journey to telling your regional economic story. Let the experts in impact planning be your guide along the way.
Interested in RUnning your own impact?
Fill out the form below to gain insight into your economic impact.


.png?width=80&name=IMPLAN_Logo_Print-Vector_NEW%20(2).png) Copyright 2025
Copyright 2025