An enormous variety of factors are at play in any given economy, and there are countless measuring tools and data sets that can help us better understand what is happening in our economic environment. In times of great change, like we’re experiencing now in the wake of the COVID-19 pandemic, it can be helpful to take a step back and look at the big picture. IMPLAN data sets provide very granular geographic and industrial levels of detail, with consistent data estimates spanning from 2001 to the most recent IMPLAN data year. These micro data can be used in concert with macro data from other sources to gain a rich understanding of local and regional economies, as well as the national economy. In today’s blog, we’re looking at some measurements that can be used alongside IMPLAN data to gain a better sense of the big picture.
Gross Domestic Product (GDP)
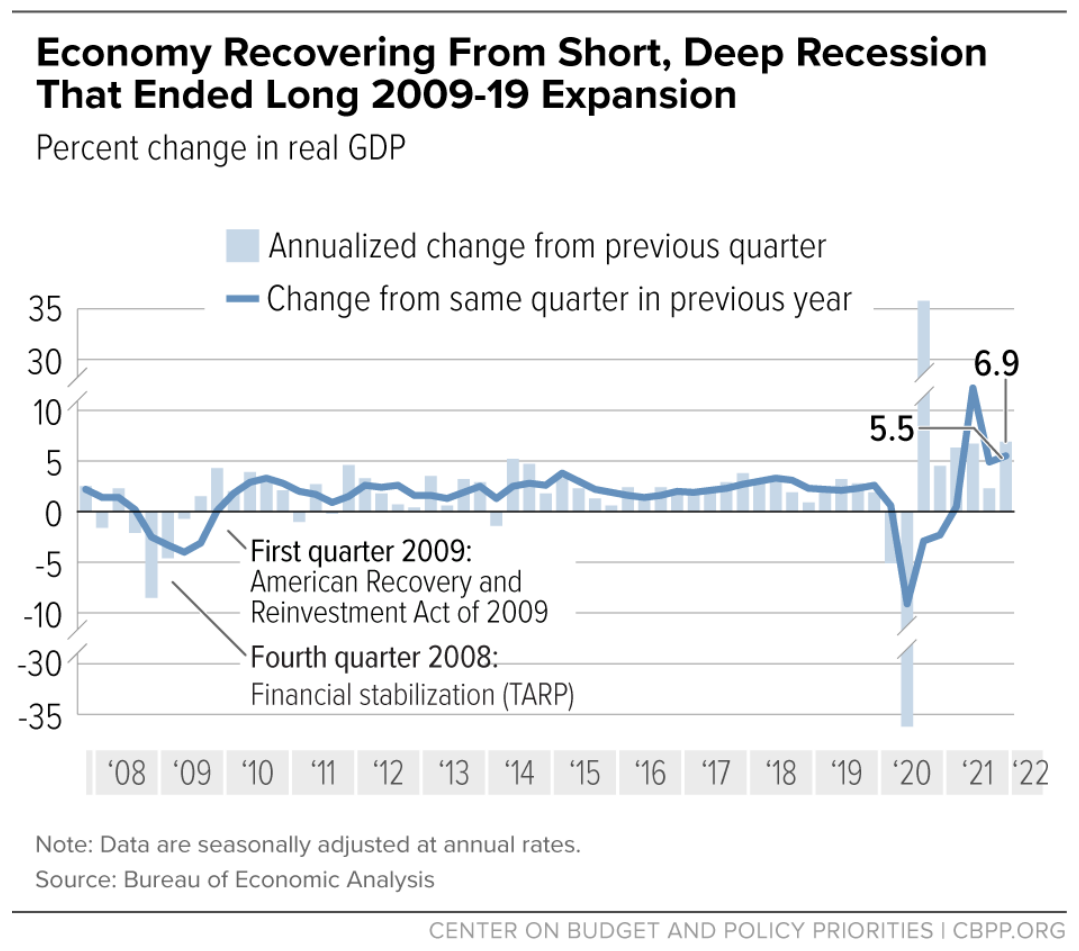
A country’s GDP is the value of all goods and services produced within that country’s borders in a given time period. Most countries report their GDP on an annual basis, but many also report GDP on a quarterly basis. Economists and news outlets will often talk about GDP growth, which is the change in a country’s GDP across time periods, expressed as a percentage. If that percentage is positive, then GDP grew across the time periods; if it is negative, then GDP shrunk across the time periods. You may hear of “slowing GDP growth” – this indicates that the percentage growth is still positive, it is just a smaller positive. Similarly, accelerating growth just means that a positive percentage growth rate has gotten even larger. If a previously growing economy begins to contract (i.e., shrink), as many did in 2020 due to the global COVID-19 pandemic, then that country’s GDP growth will have gone from positive to negative. Many countries’ GDP growth has since returned to positive.
A recession used to be recognized as two consecutive quarters of GDP decline in conjunction with monthly indicators such as a rise in unemployment. However, the National Bureau of Economic Research (NBER), which officially declares recessions, defines a recession as a significant decline in economic activity spread across the economy, lasting more than a few months, normally visible in GDP, income, employment, industrial production, and wholesale-retail sales.
According to NBER, the United States’ COVID-19-induced recession ended in April 2020 after two months, making it the nation’s shortest downturn on record.
Due to the rapid pace of change in the economy during the pandemic, IMPLAN temporarily produced quarterly economic data for all counties and states in the United States for the period spanning Q2 2020 to Q3 2021.
While GDP can be a useful measure of economic activity, especially when compared over time for a given country, it has many limitations. The following are some of the most important limitations of GDP as an economic indicator:
- It excludes the value of economic activities that are not officially monitored by the government, and therefore not included in GDP. These activities can include such things as babysitting, lawn-mowing, household maintenance, housecleaning, and even illegal drug sales. Some countries have higher levels of these kinds of non-market activities than others, making cross-country comparisons somewhat less straightforward.
- It excludes the values of public stocks of goods such as open space, clean water, clean air, and healthy forests with intact ecosystems and high levels of biodiversity. Suppose a country increased the value of its factory-produced goods by $1 billion, but in doing so, it polluted all its waterways and bodies of water. If nothing else in the economy changed (i.e., all other industries and sectors maintained the same levels of output), this country’s GDP would increase by $1 billion – with nothing to reflect that the GDP increased at a steep cost to the country’s clean water resources. The loss of clean water resources is a cost (a negative externality) to society that is not included in the equations used to measure GDP. Other costs that are not included in the measurement of GDP include things like deteriorating human health or human rights.
- Total GDP does not account for population size nor the evenness of the distribution of GDP among the population. For example, suppose Country A has a GDP of $3 trillion, while Country B has a GDP of $2 trillion. With just that information, you might reasonably conclude that Country A is “richer” than Country B. However, suppose that Country A has a population of 200 million, while the population of Country B is 50 million. The GDP per capita of Country A is therefore $15,000 while the GDP per capita of Country B is $40,000! Viewed on a per capita basis, you could now reasonably conclude that Country B is richer! While GDP per capita is certainly a more informative way to use GDP information, it assumes that GDP is spread evenly among all residents of a country, which clearly does not reflect reality. The more unevenly GDP is spread among a country’s population, the less GDP per capita reflects the average person’s economic reality.
Alternative indicators have been developed by different national and international organizations to provide a more well-rounded measure of a nation’s quality of life. These include the Human Development Index (HDI), the Genuine Progress Indicator (GPI), and the Happy Planet Index (HPI). Each of these indexes is a composite measure weighing both income and non-income variables such as life expectancy, literacy rates, environmental indicators, and measures of inequality among others.
All IMPLAN models report GDP by region (country, state, county, zip-code, or any combinations thereof), measured both by way of final demand and by way of value-added. Final demand is comprised of household expenditures, government expenditures, capital expenditures, and net exports. Value-added consists of employee compensation, proprietor income, other property income, and taxes on production and imports net of subsidies. Each industry’s value-added can be considered its contribution to the region’s GDP. Running an industry contribution analysis in IMPLAN broadens the scope to include the industry’s indirect contribution to the economy via input purchases and labor payments.
Unemployment Rate
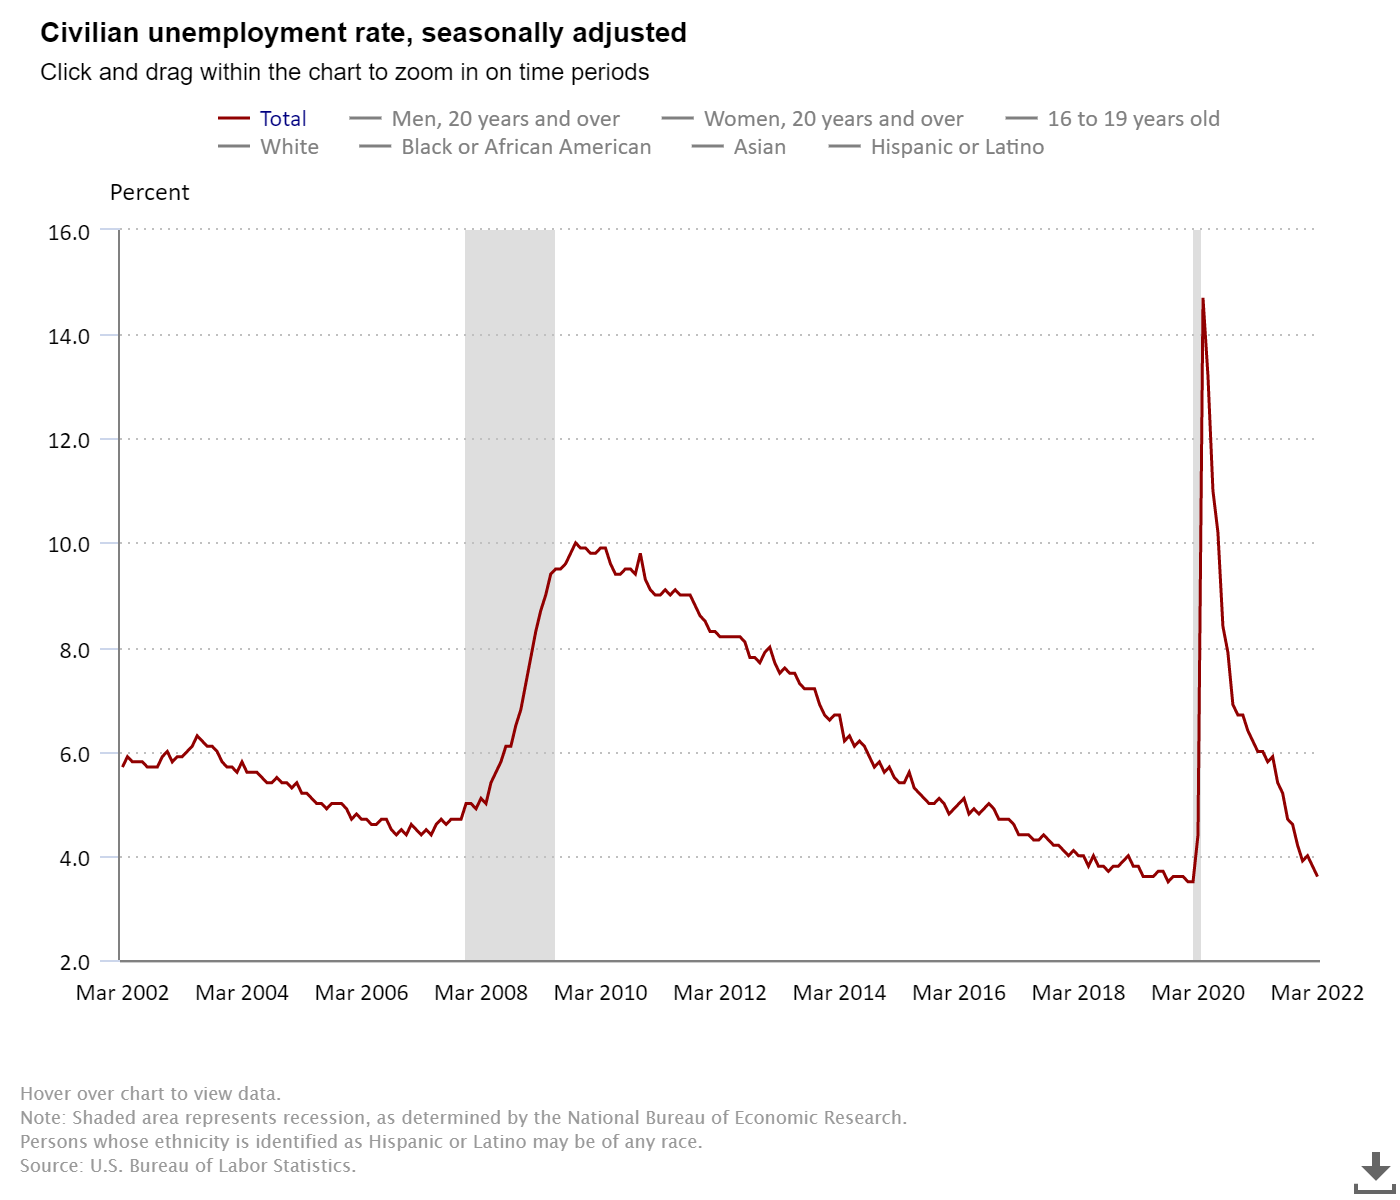
The labor force includes all people aged 16 and older who are classified as either employed or unemployed. Thus, the labor force is the number of people who are either working or actively looking for work. A person is considered unemployed if he or she is willing and able to work and is seeking employment but has not yet found suitable employment. There are multiple measures of unemployment rates, but the most straightforward is simply the number of unemployed persons as a proportion of the labor force.
While not given as much attention as unemployment, a related concept is that of underemployment, whereby a person is employed but is working for fewer hours than desired or in a position for which he or she is overqualified and not making as much use of his or her skills as he or she would desire.
There is always some unemployment in every economy, with an unemployment rate of about 3%-5% considered the “natural rate of unemployment.” Rates higher than this are a signal that the economy is producing less than is possible. Since 2020, the supply-chain issues, business restrictions, quarantines, curfews, illness, and other effects of the COVID-19 pandemic have caused the unemployment rate to fluctuate more widely than in more typical times.
IMPLAN does not currently include unemployment rates in its data and impact modeling platforms. However, IMPLAN has more than 20 years of time series data on regional employment by industry (over 500 detailed industries), by type (wage and salary employment and proprietor employment) down to the zip-code level of geographic detail. In addition to the employment values themselves, IMPLAN calculates employment-based indices including employment location quotients and the employment-based Shannon-Weaver Index of economic diversity.
Inflation Rate
The prices of goods and services change over time due to a variety of factors, including costs of production, consumer demand, trade agreements, government intervention, and more. The prices for most goods increase over time, while the prices for some goods tend to decrease over time (many technological devices and electronic gadgets fall into this category), and still others fluctuate more sporadically, rising and falling depending on the year and time of year (agricultural goods and metals are frequent examples).
An overall state of rising prices is called inflation, whereas the opposite is called deflation. The overall percentage change in the prices for a composite “basket” of goods is called the inflation rate. One of the tasks of the U.S. Federal Reserve is to keep the U.S. inflation rate around 2%-3%. Very high inflation rates make goods and services less affordable and make the dollar worth less because one cannot buy the same amount of goods and services with a dollar as before. Deflation is also undesirable because it is generally an indication that an economy is not growing. The U.S. Federal Reserve has several tools it can use to affect inflation rates – this set of tools can broadly be called “monetary policy.”
In the wake of COVID-19, the United States has experienced a period of relatively high inflation due to multiple factors, including government stimulus payments, supply chain disruptions, and increased household spending. One important reason that inflation is as high as it is currently, is that prices fell in 2020 due to pandemic-induced reductions in demand, thereby making year-over-year comparisons appear even more extreme. Because many of these factors are directly or indirectly related to the pandemic, some economists and analysts have argued that much of this currently high inflation is “transitory”, though this is looking less and less likely as time continues to pass. In any case, it should be noted that “transitory” does not suggest that prices are expected to fall back down to previous levels, but rather just that the currently high rate of price increase is not expected to continue for a very long time.
Interest Rates
The cost of borrowing money is called the interest rate. The rate you pay to borrow money depends on many things, including your credit rating, what you intend to use the loan for, and the term, or length, or your loan. The U.S. Federal Reserve influences interest rates through the implementation of “monetary policy.” Monetary policy is used primarily as a tool to affect inflation and the unemployment rate. If the inflation rate is low and unemployment high, the U.S. Federal Reserve implements monetary policy to encourage interest rates to move lower. Lower interest rates make it cheaper for ordinary people to borrow money to buy a house or buy more goods on credit. If ordinary people are purchasing more, this will increase demand on businesses that sell those things. Increased demand on business should lead to hiring more people to make, distribute, or sell their goods. Lower interest rates also encourage businesses to borrow and invest to increase production. The U.S. Federal Reserve had been implementing monetary policy to encourage much lower interest rates since 2020 but has begun to tighten monetary policy in recent weeks in response to current economic conditions of rising and sustained inflation and falling unemployment rates.
All else equal, rising interest rates tend to discourage borrowing and encourage saving. IMPLAN data sets do not include interest rates; however, they do include household savings rates and purchases of capital goods.
Gaining Deeper Understanding
The economy is constantly changing, on a regional level, on a national level, and on a global level. Sometimes we see significant variation in economic performance from one region to the next, and regions can diverge from the national economy in unexpected ways. When used in harmony with measures like GDP, unemployment rates, inflation rates, and interest rates, IMPLAN data and analyses can help you obtain a broader and fuller understanding of the economy (especially on a regional level), interactions between industries, and interactions between regions (trade, commuting, etc.).
To learn more about how IMPLAN can help you better understand your economy, book an IMPLAN demo today.