There are several advantages to using MRIO in place of traditional single-region input-output analysis techniques. Mainly, MRIO exposes the connections and dependencies between regional economies by allowing individual regional identities to be maintained as a part of a broader regional analysis. In IMPLAN, results are filterable so that in an MRIO analysis, the incoming trade to a region can be isolated from or aggregated to the local impacts of the larger surrounding region.
The study technique also reveals how output from direct effects made in one region may have a different total impact on a neighboring region versus another in the same general study area. This ability to compare outcomes from direct effects in different regions—whether on zip code, county, congressional district, or state levels—helps state and local governments, economic developers, and even real estate investors identify where they’ll get the most bang for their buck.
Of the myriad applications for MRIO, we’ve highlighted here a handful of our favorites. These not only brought to light fascinating findings, but also affected public policy and the economic wellbeing for those who call their study regions home.
MRIO Case 1: Federal Funds Stewardship
The Big Picture
The Regional Economics Applications Laboratory (REAL—based out of the University of Illinois) sought to connect the dots between the economic health of the state of Arizona and funds awarded to the state as part of the 2009-2012 American Recovery and Reinvestment Act (ARRA).
On one hand, the state had seen, over the course of several decades, a significant increase in population disproportionately spread out across cities and rural areas. The state economy, by contrast, had seen very little growth over that time. This paradoxical phenomenon stemmed from the fact that the industries which saw the greatest expansion alongside Arizona’s population growth were largely service or support sectors (which tend to pay lower wages in comparison to other sectors). Higher-paying firms remained few and far between during the intervening years of Arizona’s peopling.
ARRA was designed to specifically foster infrastructure, education, health, and renewable energy development (read: high-wage jobs) through a total stimulus package of $41.5 billion to be paid out across all 50 states. Arizona would put their portion of the stimulus to work in the “Scientific research and development services” sector which included high-tech firms offering high-wage jobs in an effort to spark economic growth.
On the other hand, demonstrating the economic benefit of securing federal funding and its impact on the economy in 2010 would prove crucial to the U.S. Government’s understanding of to what degree releasing funds actually works—and whether states like Arizona could continue to pursue its benefits.
Digging Deeper
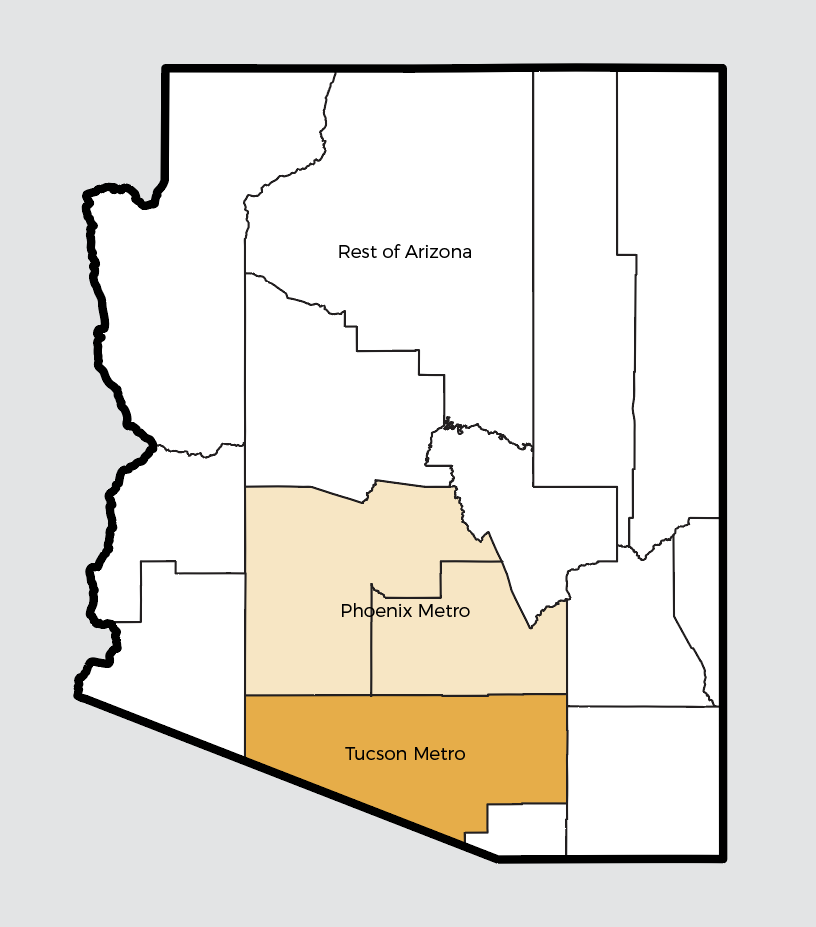
REAL’s study divided Arizona into three main regions: Phoenix Metro, Tucson Metro, and Rest of Arizona. REAL relied on MRIO to connect these three study regions and show that Arizona is, in fact, more than the sum of its parts.
Three Study Regions for REAL's MRIO Model

Starting from an MRIO framework, REAL measured jobs supported (both in total as well as by region and through region-to-region activity), industries support, and tax revenue supported.
Specifically, REAL found that “roughly 18 jobs [were] created or maintained for every $1 million of federal investment” across Arizona. MRIO enabled REAL to examine how investments in a region could have a higher output for all study regions than if the investment—or direct impact—had been made in another region. “For instance, every $1 million federal investment in Arizona and in Phoenix metro generated approximately 18 jobs while the same investment generated only 16 jobs in Tucson metro.”
Happily, much of the money spent to support these jobs circulated and stayed in Arizona. REAL found that the Regional Purchase Coefficients (RPCs—which measures what percentage of the local demand for a commodity is met locally rather than having to be imported) for the commodities demanded by the industries which received federal funding across all three study regions ranged on average from 59% to 83%.
RPC of industrial sectors with 2010 federal investments
| Industry | Arizona | Tucson Metro | Phoenix Metro |
| Architectural, engineering, and related services | 75.21% | 59.38% | 79.52% |
| Environmental and other technical consulting services | 78.76% | 63.21% | 83.07% |
| Scientific research and development services | 72.19% | 59.45% | 74.83% |
| Private elementary and secondary schools | 76.78% | 70.52% | 77.02% |
| Other private educational services | 72.75% | 58.92% | 75.46% |
RPC is a regionally specific attribute of each IMPLAN commodity and is included in the underlying data which IMPLAN provides.
The Takeaway
REAL demonstrated not only that the ARRA investment worked, but also that its effects could be amplified by investing strategically in industries and areas within Arizona that would have the greatest impact. And, most significantly, REAL found “that the labor force with both high educational attainment (alternatively, higher skill levels) and low educational attainment (alternatively, lower skill levels) benefited from the federal investments in science, research and technology.”
MRIO Case 2: Science Programs as Economic Development
The Big Picture
What does it take to be the No. 1-ranked nuclear physics graduate program in the country? As it turns out, a whole lot of help and no small measure of serendipity. Michigan State University had already been the seat of subatomic studies. But it would need more than its reputation to land the Facility for Rare Isotope Beams (FRIB—a project which the U.S. Government Department of Energy offered up funding to only one of the competing research facilities across the country to build).
Digging Deeper
MSU’s justification for hosting FRIB centered on demonstrating the potential economic benefit the facility would bring to the state of Michigan. But modeling the impact on only the whole of the state would yield somewhat misleading results. Where in the state would most of the money end up? Which parts of the state would benefit most from the program in terms of jobs supported? Wages paid? Taxes generated?
 We can’t stop talking about this story. Read more of our analysis on this project and its results here.
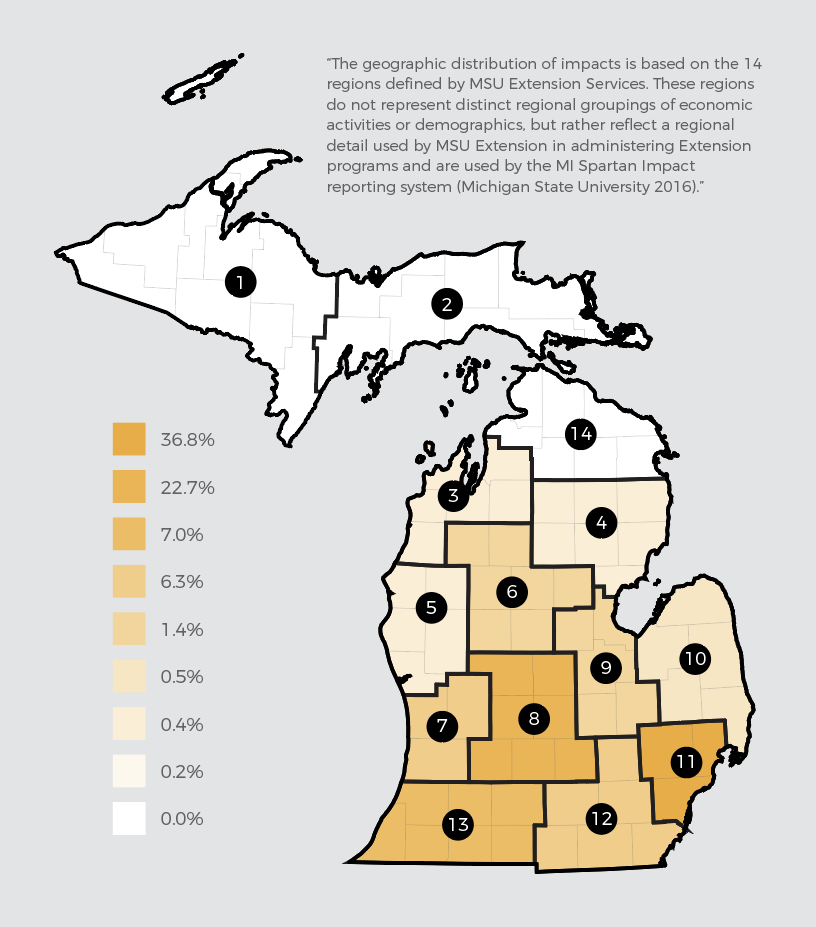
To answer these questions, the study divided the state into the 14 regions defined by MSU extension services. This showed where the money from the construction and operations phases of the facility would flow from region to region as affected supply chains snake their way across counties and as workers and students commute from home to campuses and back over the course of a year.
Geographic Distribution of FY 2009‐2015 Construction Expenditures

Ultimately, presenting the economic benefit in such a detailed way secured the FRIB project for MSU as well as unlocked additional funding from the state’s coffers to subsidize the project.
The Takeaway
FRIB amplified MSU’s technological dominance in multiple academic fields and attracted new and diverse industries and students to the state. As FRIB’s scientific advances proliferate, so too will the stature and economy of Michigan and the U.S.—and together they will achieve the DOE’s original goal of staying “engaged at the forefront of the field.”
MRIO Case 3: Policymaking
The Big Picture
Between 2007 and 2014, Georgia, on the whole, only saw a 1% job loss rate state-wide. But when you separate the state’s urban and rural areas, things look more bleak. Over that same period of time, rural Georgia lost more than 58,000 jobs (a job loss rate of 6.9%). Recovery efforts between 2012 and 2014 saw similar disparities between rural and urban regions’ ability to bounce back.
The state of Georgia looked to Louisiana’s success with the New Markets Tax Credit program as a model for designing and implementing a tax incentive program which would nurture private investment where it would count most toward economic recovery—small businesses. The Georgia Agribusiness and Rural Jobs Act (GARJA) later crystalized as a means for providing capital for small businesses in rural Georgia.
Digging Deeper
Two years before GARJA would begin awarding tax incentives, the Enterprise Innovation Institute (EI2) estimated the program’s potential output to set expectations for how and where Georgia might feel the impact of incentivized private investment. EI2’s study separated Georgia into three regions: the combined 128 county area identified as “rural” Georgia for purposes of the Act, the remaining 31 “non-rural” counties, and Georgia as a whole.
The study found that “in rural Georgia, $100 million of investment in the same industries that experienced investments under the Louisiana NMTC program would directly result in more than 1,400 jobs and $55 million in new personal income. Through additional induced and indirect impacts, those numbers increase to more than 2,600 jobs and $92 million in new personal income.”
But the results extend beyond rural Georgia’s borders. Using MRIO to examine the trade relationship between rural and non-rural regions in Georgia reveals impacts isolated to both regions even though no initial investment would be made in non-qualifying “non-rural” regions. This technique captures economic activities such as rural residents visiting and spending money in non-rural regions, businesses in non-rural regions purchasing goods or services from businesses in rural regions, or the flow of wages as workers commute between the regions defined in the study.
Over the first two years of the program, a combined $100M invested in rural Georgia in small businesses in select industries would see an increase in employment, wages, and output in both rural and non-rural regions:
Potential Economic Impact of the GARJA on Rural Georgia
|
Employment |
Wages & Salaries |
Economic Output |
|
|
Direct Impact |
1,416 |
$55,700,000 |
$192,300,000 |
|
Indirect & Induced Impacts |
1,207 |
$36,600,000 |
$149,800,000 |
|
Total Impact |
2,623 |
$92,300,000 |
$342,100,000 |
Potential Economic Impact of the GARJA on Non-Rural Georgia
|
Employment |
Wages & Salaries |
Economic Output |
|
|
Direct Impact |
0 |
0 |
0 |
|
Indirect & Induced Impacts |
414 |
$24,600,000 |
$70,900,000 |
|
Total Impact |
414 |
$24,600,000 |
$70,900,000 |
The Takeaway
EI2 forecasted that Georgia would recoup the entire amount of awardable tax credits within 10 years. Until then, the state would see an economic lift of the “creation of more than 3,000 jobs, $117 million in new personal income, and $413 million in new economic output.” Even though the study examines hypothetical effects ahead of GARJA’s official launch, it sets up a study methodology which can be repeated with economic data collected after the initial two years of the program to size up GARJA’s performance and make adjustments to the program to affect greater economic recovery in rural Georgia.
Wrapping it up
MRIO offers a framework to answer the simple question “what’s the economic relationship between regions?” But its practical application fans out across every industry and region in immeasurable ways. The added clarity that the analysis technique delivered in these Arizona, Michigan, and Georgia studies could very easily be borrowed line for line by any other state. Naturally, there are far more MRIO-based studies out there to learn from as well. So no matter what you may be curious to measure or are currently studying, there’s more than a good chance that MRIO can help.


.png?width=80&name=IMPLAN_Logo_Print-Vector_NEW%20(2).png) Copyright 2025
Copyright 2025