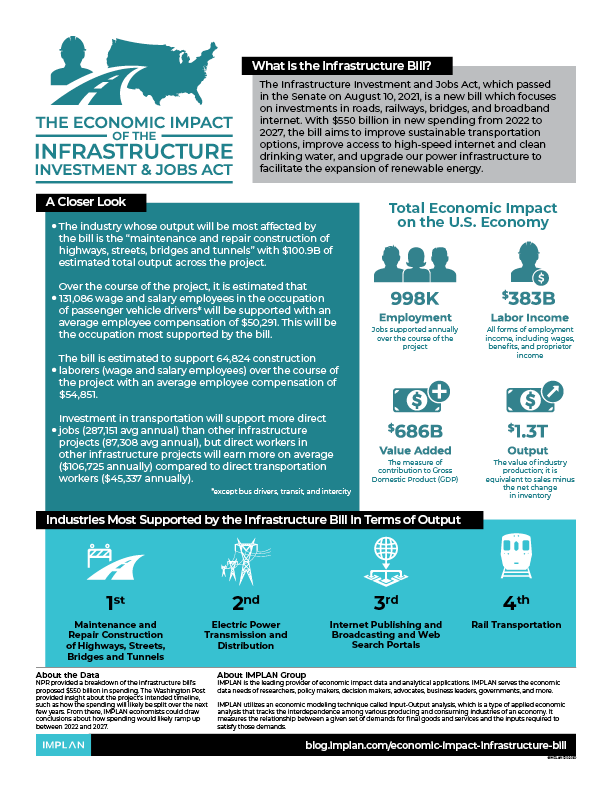
In early August 2021, the Infrastructure Investment and Jobs Act passed in the Senate. By the end of the month, the House of Representatives agreed on a September 27 deadline for voting on the bill, and given its bipartisan support, it is expected to pass there as well. This new bill focuses on investments in roads, railways, bridges, and broadband internet. It proposes $550 billion in new spending from 2022 to 2027, with the aim to improve sustainable transportation options, expand access to high-speed internet and clean drinking water, and upgrade our power infrastructure to facilitate the expansion of renewable energy.
These are exciting goals, backed by a lot of money. But what exactly will the economic impact of these investments look like? The ripple effect of this large amount of government spending can be expected to make a difference across the country, not just in the industries where it is initially spent, but also far beyond. We can get a clearer picture of the infrastructure bill’s impact on the economy through Input-Output Analysis performed by economists at IMPLAN Group, LLC, the leading provider of economic impact data and technology.
Analyzing the Data
To predict the economic impact of the infrastructure bill, IMPLAN economists first gathered data about the proposed spending. NPR provided a breakdown of where the plan proposes that the $550 billion should be spent, from $25 billion going into airports to $65 billion going into broadband. Meanwhile, the Washington Post provided insight about the project’s intended timeline, such as how the spending will likely be split over the next few years. From there, IMPLAN economists estimated how spending would probably ramp up between 2022 and 2027.
Next, using a model of the U.S. economy, IMPLAN economists entered spending by year as previously estimated. The spending was run through the IMPLAN model, which calculated the bill's impact on jobs, labor income, national gross domestic product, and taxes.
Economic impact analyses estimate the ripple effects that a change in a given industry’s activity has on interdependent industries. Economic impact totals include the economic activity of the analyzed industry, the businesses supported in their supply chain, and the effect of the household spending of labor income earned in each layer of the activity.
Results
IMPLAN’s analysis found that investment from the infrastructure bill would support a total 998,826 jobs annually and $383 billion in labor income over the six year period. The analysis estimated that the bill would generate over $86 billion in federal tax dollars, or 15.75% of the total investment. The bill would support an estimated $686 billion contribution to the National Gross Domestic Product. All economic impact figures result from an analysis-by-parts performed in IMPLAN V.6 Data year 2019. Results do not take into consideration any associated opportunity costs.
|
Impact |
Total Employment* |
Average Annual Employment |
Labor |
Value |
Output |
|
Direct |
2,246,753 |
374,459 |
$134B |
$247.4B |
$508.1B |
|
Indirect |
1,638,316 |
273,053 |
$126.8B |
$221.7B |
$439B |
|
Induced |
2,107,884 |
351,314 |
$122.2B |
$216.9B |
$386.8B |
|
Total |
5,992,953 |
998,826 |
$383.1B |
$686.2B |
$1.334T |
* Over the six-year period that was modeled
The total economic impact is split into three levels of effects: direct, indirect, and induced. Direct effects are the initial effects attributed to the government’s spending as planned in the infrastructure bill. Indirect effects stem from business to business purchases in the supply chain. Induced effects stem from domestic household spending of Labor Income, after removal of taxes, savings, imports, and commuter income.
Results are expressed in terms of employment or dollar figures. Employment is not necessarily defined as new employees, but as an annual average count of full-time, part-time, and seasonal employment supported. Output is the value of industry production. Impacts are broken down further into multiple components like Labor Income, Value Added, and Intermediate Inputs. Labor Income represents all forms of employment income, including wages, benefits, and proprietor income. Value Added is the measure of contribution to Gross Domestic Product (GDP). Because the impact of this Infrastructure bill was broken down into six separate years (from 2022-2027), IMPLAN economists also converted the Total Employment figure down to an "Average Annual Employment" figure. This conversion is necessary because of how Employment is defined in IMPLAN, where one worker who works on site throughout the duration of the project, 2022-2027, would be counted six times. To do this, it was necessary to simply divide Total Employment by the number of years the project is assumed to take to complete, leaving the average amount of jobs supported from year to year.
These values provide greater insight into the complete impact of any analyzed economic activity.
A Closer Look
Diving deeper, IMPLAN’s analysis also resulted in some exciting revelations about which industries and occupations would benefit most from the infrastructure bill.
Over the course of the project, it is estimated that 131,086 wage and salary employees in the occupation of passenger vehicle drivers (except bus drivers, transit, and intercity) will be supported with an average employee compensation of $50,291. This will be the occupation most supported by the bill. The industry whose output will be most affected by the bill is the “maintenance and repair construction of highways, streets, bridges and tunnels” with $100.9 billion of estimated total output across the project.
Additionally, the bill is estimated to support 64,823 construction laborers (wage and salary employees) over the course of the project with an average employee compensation of $54,851.
Investment in transportation will support more direct jobs (287,151 avg annual) than other infrastructure projects (87,308 avg annual), but direct workers in other infrastructure projects will earn more on average ($106,725 annually) compared to direct transportation workers ($45,337 annually). 63% of direct transportation jobs require a high school diploma/GED or less, while less than 50% of direct other infrastructure jobs require a high school diploma/GED or less.
What it Means for the Future
While the infrastructure bill has passed in the Senate, it still needs to go through the House of Representatives before it can make its way to President Biden’s desk and be signed into law. On August 24, 2021, the House locked in a September 27, 2021 deadline for voting on the bill.
The White House calls the infrastructure bill the “largest federal investment in public transportation ever” and the “largest investment in passenger rail since the creation of Amtrak 50 years ago.” IMPLAN’s analysis shows that the bill’s impact will span far beyond its direct target, making a significant change in households and in the U.S. economy at large.
